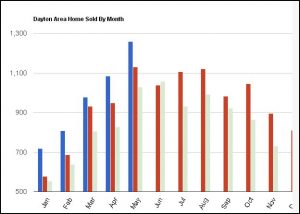
Real estate is local, so if you want to know what is going on in a local market check my real estate market reports for Beavercreek, Fairborn, Huber Heights, Riverside, Tipp City. But real estate is even more local than that as one neighborhood can vary dramatically from an other, in which case you need to call me to find out exactly what is going on in your neighborhood. But we can get an overall idea of the health of the real estate market in the Greater Dayton area by looking at the big picture.
Sales of single-family and condominium units reported by the Dayton Area Board of Realtors during the month of May totaled 1,258, 173 more than April’s tally, representing a new monthly high for sales so far this year. The sales volume produced by this activity reached over $161.77 million, and translated to an average sales price of $128,592, also a new high for 2013.
The median sales price of $110,000 in May showed a year-over-year increase of 3.77%, while the average sales price showed a slight drop-off of 1.1% compared to the figure of $130,007 in May 2012. This decrease was only the second year-over-year-decrease in monthly average sales price in 2 years.
The slight decline is easily overshadowed by looking at the year-to-date sales. A sales total of 4,969 through the first five months easily eclipsed the same period in 2012, when 4,347 single-family and condominium properties were sold, a 14.3% jump.
The year’s transactions so far produced a cumulative sales volume of over $597 million, a 17.5% increase compared to the same period last year; an average sale price of $120,160, a 2.83% jump; and a median sale price of exactly $100,000, a 4.17% increase.
Listing entries in May nearly mimicked those added in April with 2,431 additions, only 22 more than last month, but a considerable 13.3% increase over May of 2012. Year-to-date, the 10,099 listings entered was a 6% rise over the previous year.
Listing entries have increased in recent months, but thanks to strong sales activity, MLS inventory has remained lower in year-over-year comparisons for 22 consecutive months, a trend which has been a strong catalyst for rising sales prices. This trend continued in May, when inventory at month’s end stood at 7,382 available active listings, a drop of 7.4% from last May. This translated to a listing supply of 5.8-months based on May’s resale rate. This was down from April’s 6.5-month’s supply, and was one of the lowest supply ratios in recent years.


0 Comments